The Tier Trap
As Introduced at RSAC26! The Tier Trap introduces the Dual-Signal Model — a disciplined framework that separates governance integration from operational reliability. It explains why organizations with identical maturity scores perform radically differently under stress, during audits, and through leadership transitions.
This paper clarifies:
What the NIST CSF Tiers measure — and what they do not
Why composite maturity scores distort structural risk
How to independently measure Governance Maturity and Safeguard Maturity
The four sustainability states of cybersecurity programs
The governance-precedence principle: why stability must be built before scale
Evidence-based scoring rules that prevent maturity inflation
RIIOT Frame tool

As Introduced in The Security Risk Assessment Handbook (Ch. 10).
The RIIOT Framework Risk Assessment Method - Example (RIIOT FRAME) streamlines the security risk assessment process by aligning the assessment method to the RIIOT data gathering process. This tool implements both the qualitative and quantitative RIIOT FRAME options.
Risk tolerance curve

As Introduced in The Security Risk Assessment Handbook (Ch. 9).
You can create a risk tolerance curve (RTC) by plotting security risk distributions of the organization’s security risk appetite. This worksheet demonstrates the creation of a RTC through an example and shows how multiple risks can be added to compare against the RTC.
Security risk assessment diagrams

As Introduced in The Security Risk Assessment Handbook (Ch. 14).
Full version of security risk assessment method figures including:
NIST SP 800-30
OCTAVE, OCTAVE-S, OCTAVE-Allegro
IRAM2
FAIR-BRAG, FAIR
RIIOT FRAME (Qualitative), RIIOT FRAME (Quantitative)
Security Risk Assessment Course Slides

PowerPoint slides covering all chapters of the text created by Professor Michele Varin, Bryant University. These slides may be useful to anyone teaching a security risk assessment class based on the Security Risk Assessment Handbook. Includes the following:
Chapter 1: Introduction
Chapter 2: Basics
Chapter 3: Project Defintion
Chapter 4: Security Risk Assessment Preparation
Chapter 5: Data Gathering (2 parts)
Chapter 6: Administrative Data Gathering (3 parts)
Chapter 7: Technical Data Gathering (2 parts)
Chapter 8: Physical Data Gathering (2 parts)
Chapter 9: Security Risk Analysis (3 parts)
Chapter 10: Security Risk Analysis Worked Examples (2 parts)
Chapter 11: Security Risk Mitigation
Risk Probability distributions
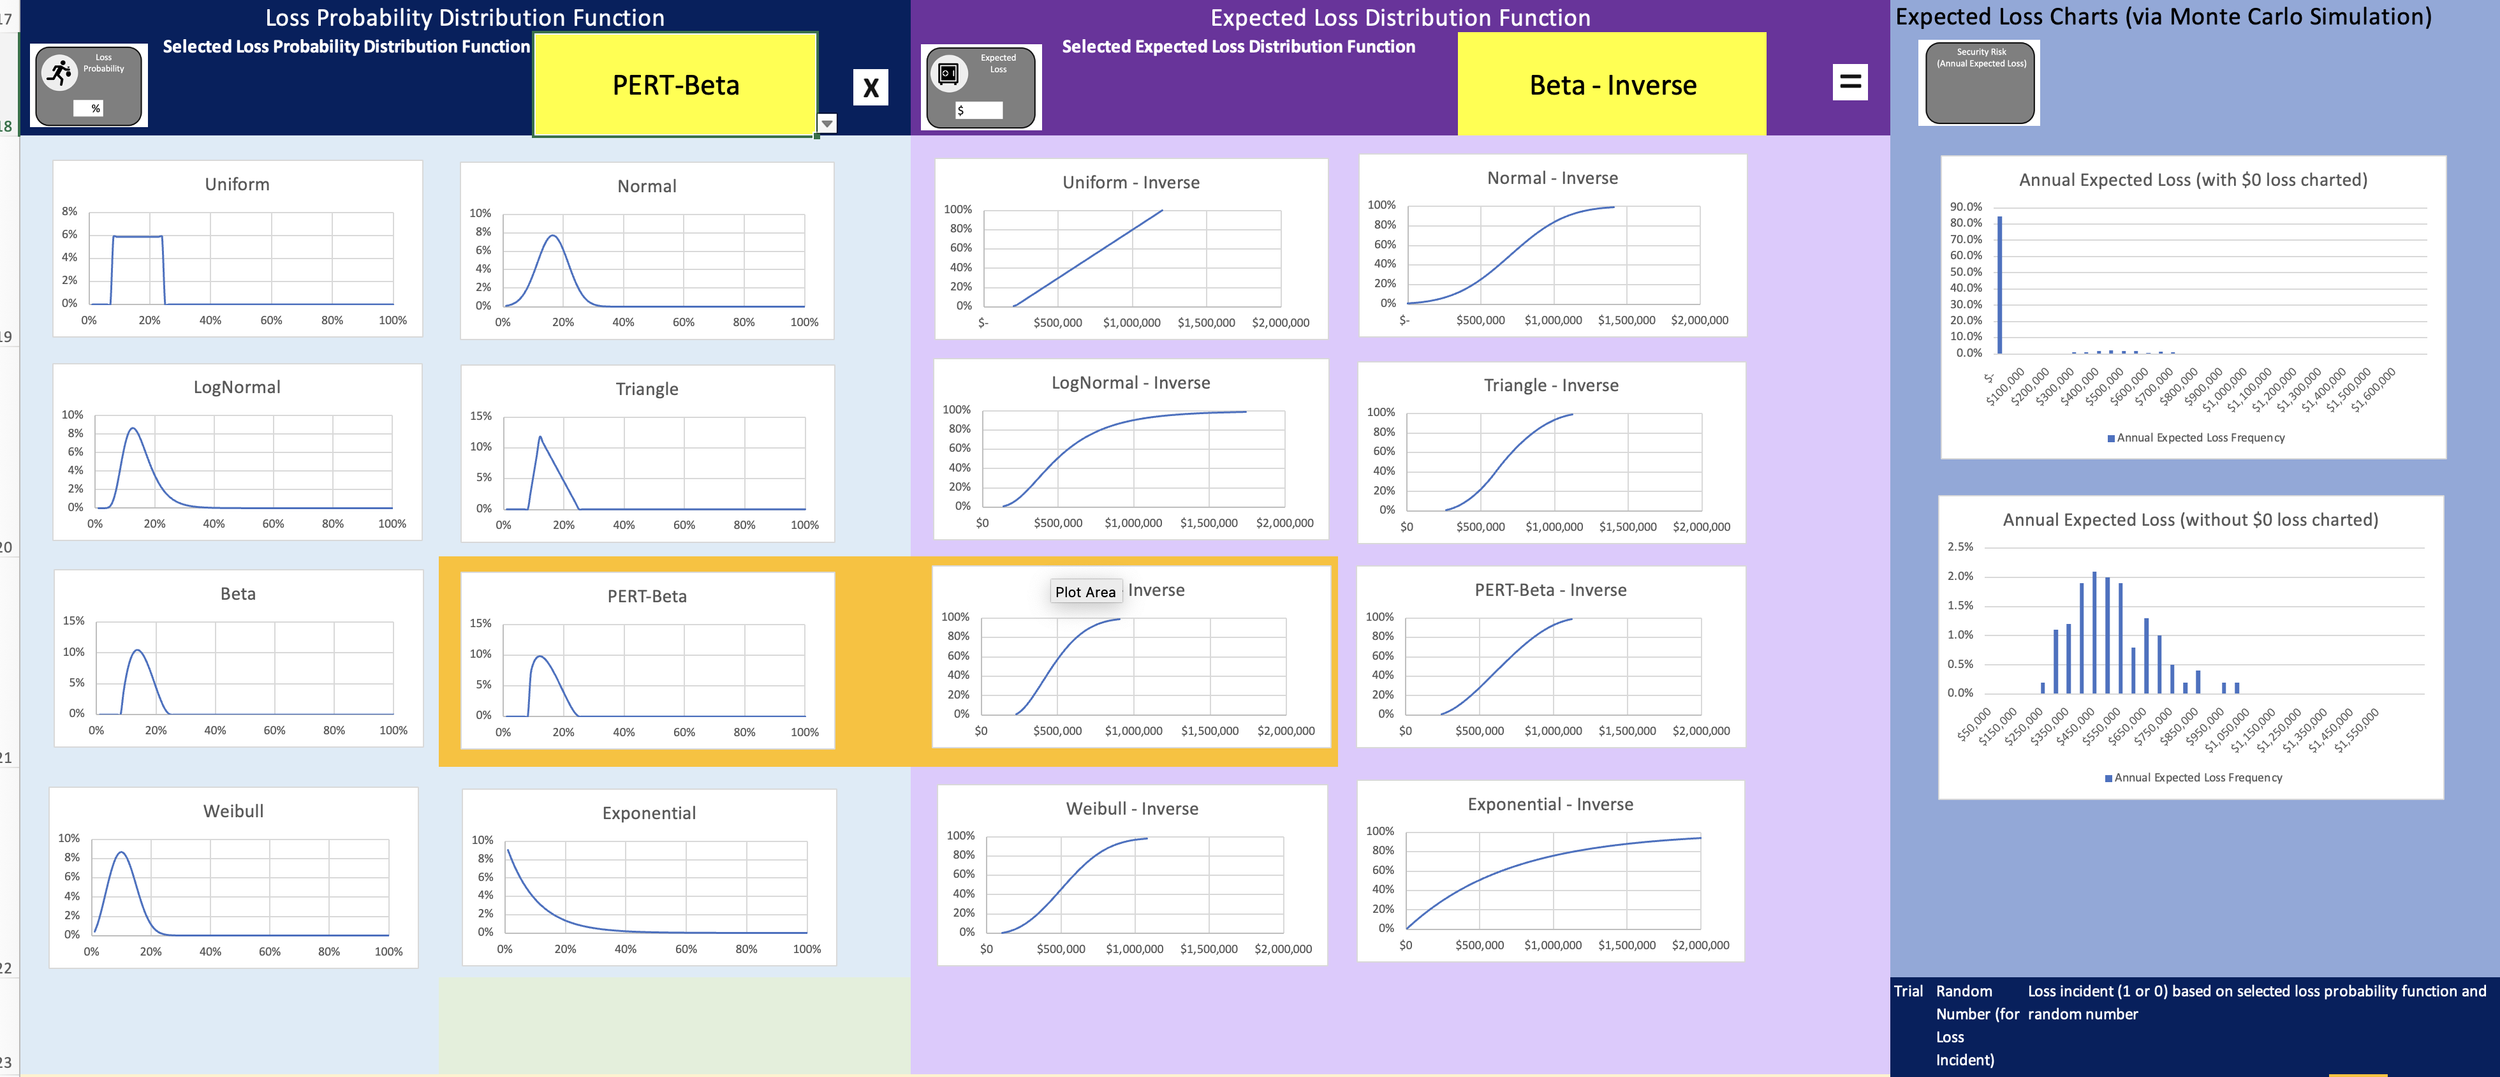
As introduced in The Security Risk Assessment Handbook (Ch. 9)
Probability distribution functions (PDFs) are introduced in Ch. 9 as an alternative to simple estimations or other assignments of values to the basic security risk equation (see Section 9.3.3).PDFs may be discrete (e.g. countable) or continuous. Using a PDF the assessor may model the estimate of the security risk equation variables to more closely estimate the variable behavior. See section 9.3.4.2 for advice on PDF selection.
Downloads
Filters
No results found
No results match your search. Try removing a few filters.